TIMING BETTER ENTRIES PART 1 — Jackie Le' Tits — Video Wiki
Chart Drops 📈 (6)
The Receipts 🧾
Full transcript (5,721 words) — every glorious word
0:00so on the YouTube like I said uh we we had that that uh video that we created right with what do you struggle with the most and the number one at least top commented answer or most liked answer I saw was entries and exits right so I'm going to give you guys a little bit of kind of like a tip on how you can do that better right how how you can time entries and exits perhaps um a little bit better right now listen what I'm going to show you here right what I'm going to show you here there's a couple of different things um you know I'll say maybe the first one will focus on uh like the really really simplistic side of things like support and resistance um the next one that we'll talk about is using indicators right so um I think what I'll probably do with you guys and how we'll focus on this is we'll use the RSI and then because some of you guys are familiar with it because uh we did that video recently I'll also do the uh adx DMI indicator as well okay so we're going to start on djt all right because this is a recent trade that a lot of people got to witness live on on the YouTube and so this is just going to be a really good uh lesson so how can I time entries and and exits better so let's let's focus on the first part of that how to time entries better so the first way I'm going to show you guys or um you know way that you can potentially use this analysis to identify ways to do this all right is simply just using support and resistance all right now uh I never really used these very often before but since the YouTube thing has grown so much and since we have so many people kind of following Along on like a day-to-day basis uh you know just with the stocks and whatnot right uh because nothing said here is financial advice it's all just educational content right and and one of the things that I've you know kind of grown to notice is people love visual helpers right people love having something visually to see that can kind of uh help guide them right so what
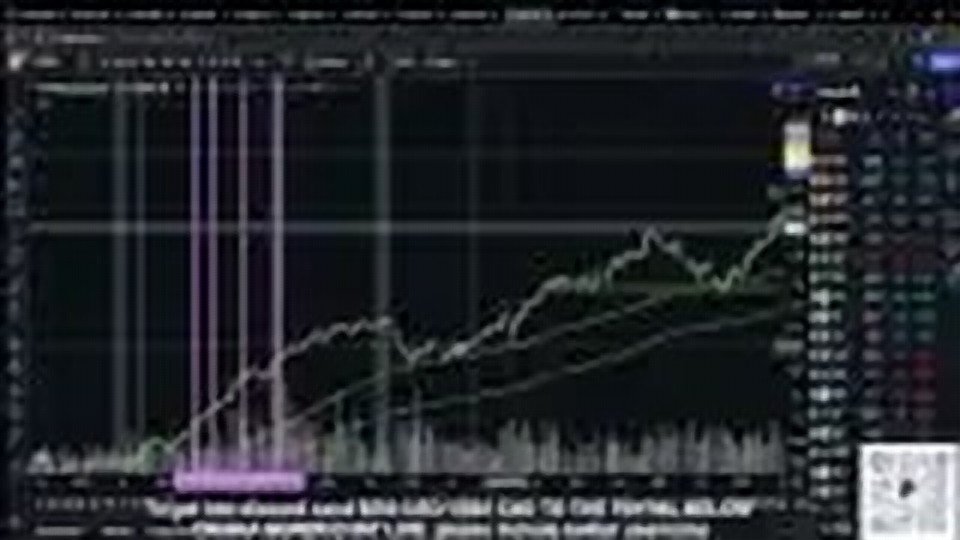
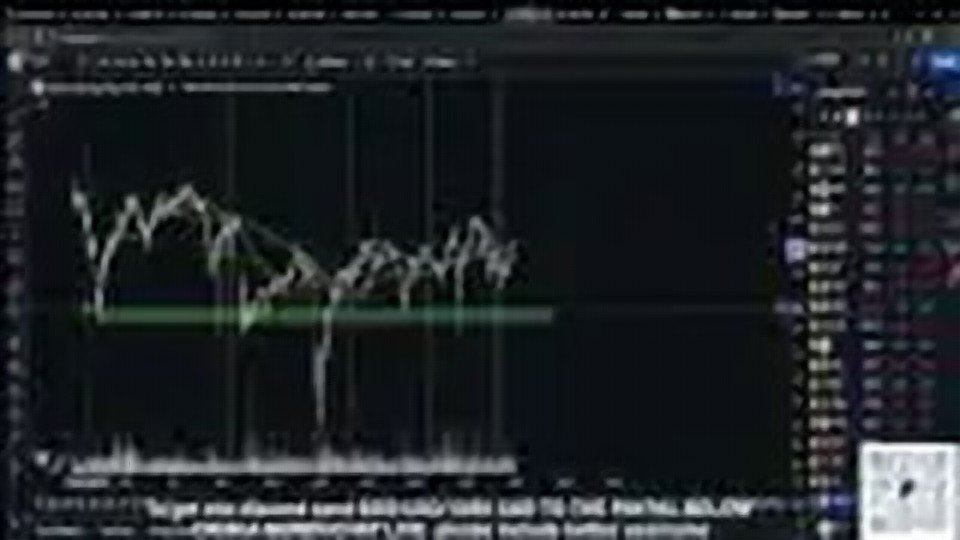
2:17I've started doing right you guys saw it on djt we did did it on gme we've done it with uh lpsn SYM like a couple of different stocks that uh we'll get into and I I'll explain more but I've started drawing like colored boxes right and this is not something that's like incredibly like this isn't thought-provoking stuff right like we're not sitting here going like oh my God my brain's exploding from all of this Jackie ISM oh my God he told me about support and resistance holy cow I'm [ __ ] rich now like that's that's not it right the the reason that I draw these boxes and stuff on here right is to visually help people understand support and resistance and how you can use that to time entries right so with regards to djt right so djt when we were watching this prior to this trade that we put on right me and my multiple personalities prior to that trade that we put on it was trading it about here and somebody was asking you know how how can you time an entry on this thing if you're looking for an opportunity to long this right and so I explain in the most simplistic way that you just look over to the left because the left has all prior price action right not to be confused with the liberal lefties oh no but looking left on the chart right and left side of the chart has all of the old information right the highs and the lows and the highs and the lows and the highs and the lows and the resistance and the support and the resistance and the right and when djt started to really break down and start trending lower and lower right it was just common sense at that stage that when djt had broken this prior low where we had seen the stock kind of consolidate pretty nicely uh multiple times right once it had broken that low it was common sense that we were going to Target this level down here right and so I drew a big [ __ ] green box green right in most people's brains they think good right good associated with support So if I draw the box and I make it green people will assume right that the Box being green
4:44that probably constitutes support right so looking at how can I get better entries right so going to circle this all back around right how can I get better entri R the number one thing in my opinion is simply identifying the clearest areas of both support and resistance every single trade that I have ever taken in my career has essentially focused purely on support and resistance obviously a combination of a a whole slew of other things but the Crux of my entries and exits are almost solely focused on supports and resistances and so I always look left and when I see price pause at a very clear level and then I see recent price action hesitate and pause at that very same level as well then I will then once again go into trading view on the brush section here hit the [ __ ] rectangle thing and I'll just encapsulate you know some chunk of price action that is roughly about where support is right and I I draw it across there and those areas give you clearly defined areas of both support and resistance right very clearly defined areas of both support and resistance so you can see that when djt started dumping and it first in foremost hit the green supportive box we identified okay the stock is now at a potential entry zone why is it an entry Zone it is support fundamentally stocks very rarely will just blast through [ __ ] support it's just not really a thing that happens often times what will happen is stocks will go to those supportive levels and sometimes they will Wick underneath them in the same thing on the opposite side where in resistance often times price will Wick above the resistance box but come back inside and go down why does this happen because like most Traders right they are very simple creatures they draw these little boxes too but guess what they do chat they draw their entry here and they put their exit at the bottom of the Box some of them are smart enough to put it a little bit lower but that's their trade right that's what their trade looks like and you want to know why their trade is a loser because the computers are smarter than us un fortunately and they recognize that there are thousands
7:32of orders that have stop losses right there so why wouldn't the computer then be smart enough to dig through those stop losses kill those trades take that liquidity and then push the stock up from support So if you are trying to find better entries fundamentally the first thing that starts with is finding and identifying support and resistance and drawing boxes around around it to make your life a little bit easier the next fundamental thing that happens is buying the candles that look scary in those moments dude you're crazy if you don't think when we were looking at a potential trade on djt you're crazy to think that that didn't spook people you're crazy to think that that candle didn't spook people dude you blew through the green box of support that we drew that was the lowest load that we had seen on the stock you you blew right through it of course that was going to Spook people out but guess what that's the trade that that's the trade when it looks the most grim and everybody is panicking and everybody's freaking out and everybody scared right if the stock is at support or slightly below it think about the macro is that candle potentially a wick on a larger time frame well what if the stock bounces from here and then that candle that happened on a Monday turns into a weekly wick on the candle and suddenly you see a weekly candle wick into that low and explode off of that wow is that a bullish candle guess what [ __ ] happened chat now you guys are going to see that this stupid [ __ ] exploded right now beyond the fact that it exploded look at the weekly candle that happened last week or two weeks ago sorry when it Wicked into our green zone look at that most people would see that and they'd say holy [ __ ] is that bullish that thing dipped into support grabbed all that liquidity and then held all the way back up here so you're telling me that this thing Wicked into liquidity and then bounced 26% how is that not bullish especially on a stock like this but that's just that's just it while everybody was afraid to buy here or buy on the next day when it started underneath that
10:21right other people said well I want to buy that because listen you guys want better entries this is the key because when you take those entries on those spooky [ __ ] lows right you go into your broker because you're smart right and you're not dumb right you go into your broker and then you set your stop loss as soon as you buy the [ __ ] you got to go in and you got to set the stop loss don't be dumb but if you bought those low scary candles that Wicked underneath support now at the time we didn't know that it was is going to bounce there was no guarantee but if you bought those scary candles right your stop loss right most people when they are trying to time potential swing trades right they'll give themselves about a 5 to a 10% buffer right so I like for my examples just to show you guys 10% right I like to just show you the wider one but in this scenario too right you could have done a 5% stop and you wouldn't have been stopped out right you wouldn't have been stopped out but most people right would give themselves 10% especially if you're just trading simple common shares right so if you gave yourself 10% on that trade and you smartly set your stop loss at your 10 whatever right 1090 right if that stock had just completely exited the chat you're stopped out instantly and you lost the 10% but if you are right not only did you catch the algorithmic stoploss hunt you bought it and if you time that entry buying those scary candles at support that can lead to a trade like this where the stock goes up from those lows 99 100% you doubled your money congratulations you doubled your money in what how many days did this take I already forgot that took a little over two weeks a little over two weeks and you doubled your money is there a single person that is pissed off about doubling their money I I don't think so so if you're looking to time better entries from a risk and a reward perspective you want to buy those scary candles that happen at or slightly below support and or resistance right if you're trying to go short the
13:21same concept applies right the same concept applies when being being short right I can show you guys that with an example on Tesla because Tesla was a fantastic short that we just completed or I should say we as in me and my multiple personalities and I just personally cut this trade right so let me explain now you can already see on the chart that I've got it drawn on there for you so I'm just going to clear some of this out here so that we've got space here all right so couple things first of all we identified a macro area of support and resistance we identified this because we noticed that the stock had rejected here and dumped rejected here and dumped rejected here and dumped rejected here and dumped a little little bit higher than it but regardless rejected here and dumped and then back over here it was supportive bounce rip supportive bounce rip support of Bounce lost and then it became resistance right but that area was a clearly defined area both support and resistance and we knew on a macro scale it was so I drew a red box above that white trend line where that resistance was right I drew a red box here and I said that red box is resistant and then I said there's a harmonic that has completed at that level and I said the other Common Sense thing is to Simply look over to the left and looking over to the left immediately we identified this Wick high and we identified the candles here and we have identified that Tesla on the macro has made a lower high or excuse me a high a lower high a lower high lower high a lower high if it stopped there and so in that moment we identified okay couple things that's a high that's resistance that's a harmonic and that looks gross so any entry within that red box or on that white trend line with a stop loss above that prior High makes common sense why does it make common sense you've got the harmonic completion you've got the stock at resistance you've drawn your red box you've seen the stock make four consecutive lower highs right and everybody in their sister was telling you how bullish Tesla was because Tesla over the last few weeks
15:46had at that time gone up 28% and it looked like it wasn't going to stop but this goes back to the concept of buying scary candles and targeting those entries because we knew that this was resistance do we have a reason to short yes it's at resistance do we have a clearly defined strategy to enter and exit this trade yes our exit and risk is the top of this prior High our full profit Target is the 3a2 off of the harmonic completion and the prior areas of resistance right here that's our exit and then we watched it Wicked into that zone right with this candle here and then it did it again here right two scary candles it's going to break out it's going to break out look how bullish it is oh my God and and then it craters not only does it crater now we didn't get the 382 profit Target yet just FYI but let me explain something remember how I just explained that the profit Target is the prior res resistance this is resistance right here this is it rejected dumped rejected dumped rejected dumped finally broke through huge move come back and back test it look at what we just did Green Box supportive Red Box resisant green support red resist green good red bad and you see how all I'm doing is literally drawing [ __ ] stupid idiot boxes this was a Red Box until we broke above it here and then it becomes a green box because now we're trying to turn resistance into support and look at what has happened with Tesla since hitting that [ __ ] Green Box you see how simple you can make it [ __ ] the harmonic [ __ ] divergences [ __ ] CH patterns bro I literally just draw boxes I'm like a [ __ ] kindergartener I I just draw boxes and it goes to the box and I'm like okay if it goes outside of the box I'm going to short the [ __ ] out of it and then the next time it happened I was like okay well I don't want it to go outside the box this time so I'll put my stop loss outside of it 10% and I'll put my profit Target where it always has been and then it goes
18:32there and then you lock in profit which is what I did today literally right at the [ __ ] bottom it's not coincidence that these things keep happening it's just common sense trading and I know that people struggle with like okay you know like that was only 10% like that can't be worth that much right bro Bros the contracts on these were three grand I sold them for 4,300 when we had the long trade that we entered right here that was another three grand that we made that paid for the entirety of the Tesla trade and now I walked away from this thing $4,300 richer and did it make a massive move not really 10% really but but it worked and because it worked and because I was smarter than the market makers I took advantage of it so timing entries and and exits can quite literally be as simple as drawing boxes you guys love GameStop you guys love GameStop I know this I know the large majority of my my followers are GameStop guys right well look at this right how did we call the bottom at 10 right beyond the harmonic that we had drawn and all the other shut uh all the other [ __ ] that we were watching right watch this take a box look at where Keith bought right this is where Keith bought the second time when he was in Congress right and then look at where the stock kind of paused and hesitated before the short squeeze so if we just draw a box roughly around that area of price action right and then we just drag it across do you think it's coincidence that we bought that and then sold that [ __ ] you that's Locker coincidence that's literally common sense and all he did is draw a [ __ ] green box with my [ __ ] Nostradamus because I draw a [ __ ] green box there's just nothing that makes more sense than those things for you guys to try to work on your entries and exits and I say this because like you could have said right when we were trading GameStop you could have said at any moment okay it's in that green box I'm I'm going to even buy the top of the green box okay you bought
20:53the top of the green box no problem now trading view for for whatever reason gives you a minus gazillion [ __ ] stop loss which makes literally no sense but anyways oh so with this box that we have now taken an entry right at the top of the green right shouldn't do that but we did it anyways right now we have a clearly identified risk the risk is that Wick low right you want to put it just slightly underneath of it you can do that too right I think that's actually what we did I think we gave 15% on this right I just as an example here right that's the trade was your entry perfect no but did you make [ __ ] 60 plus per. [ __ ] yeah you did and you knew how to time that entry better how did you know to time that entry better you drew the Box dum dum you buy the lowest of side of that box as you can because then Watch What Happens here the lower that you get that entry watch my stop loss now because there's the wick right so look at what I can do with this now now all of a sudden my stop loss went from being [ __ ] 15% to five now look at the risk reward it's double and all you did was just have [ __ ] patience that's it it it just ain't that deep so what I want you guys to do right hey chat while I'm doing this live right now somebody give me a random ticker don't give me something that we've talked about give me a random ticker that we've rarely looked at and yes this is being recorded give me a random ticker okay uh the first one I saw was Nvidia no that's great perfect okay so watch chat listen get the get rid of the harmonic get rid of the drawings get rid of the Fibonacci get get I'm getting rid of all of it okay and I'm going to show you right you can even see I've already gotten a box drawn on there right okay watch check this out these are the highs that Nvidia is currently at right these are the highs that we've been at for this year there is no higher highs than
23:16this this is the highest nvidia's ever been right so what can we do to draw support resistance right look simple these two highs were resistance before back over here when it was resistance as well then we gapped above it and then it just ripped to a new high easy we're going to draw a [ __ ] box around that bit of price action look at where the stock goes into on the market crash Mondays a slight Wick below and an explosion back up easy [ __ ] trading right but now look at this okay you guys have now identified another key area of support cuz we seen the stock come back here twice and bounce off this range so what can we do we can just take another one of these things right encapsulate roughly the price action right there right there's another layer of support right and now look above right we've now got this yellow box now I think I drew this yellow because it was a golden pocket if I remember from this high to that low yeah so that's roughly the golden pocket so that's why I made that go but we've got this area that was resistance right and then we broke above it support bounce support bounce support oh we broke through it resistance dump oh broke through it support oh no reject resist reject resist above it NOP back back test boom so we can identify that this area here maybe we could probably like maybe just like maybe just like that you know maybe that's like a little bit better and we can mark this one green now too because price is above it that's support right okay now the best one right this is easy right we're going to take a box we're going to encapsulate it from roughly these two highs here right and we're going to go to that those lows right there just drag that across and we're going to make it red because we think that that's resistance right we think that's resistance so really [ __ ] easy now I'm not please please please this is not a trade suggestion I'm not telling you to do anything with this this is purely educational content if I was looking at shorting Nvidia Common Sense would dictate right that I would look at
25:19a short position where the stock is roughly now or maybe even as high to that red box as I could get with my stop- loss above that prior high right let's see what the percentage is right so that's 5% that's pretty good maybe we could give us a little bit more right maybe we'll give us like 7% right so then we've got our stop- loss set like that and then we know the exit is at support now is this trade worthy of of taking look at your risk reward it's less than a 2: one that is [ __ ] so what can you do to get a better risk reward trade well you can try and time a better entry but then you're talking about the stock being right near high that it could potentially explode past and then you're just going to get ass blasted that's part of the gamble that you take with shorting things that are right at resistance that's why we Mark these boxes so Nvidia that's an example right there of how you can Mark these and look I we can use old price action as well right let's let's go back to the the market retracements right let's go back to over back here right how did people find a way to make a shitload of money on Nvidia right how did people find a way to call these bottoms on Nvidia and do all this and blah blah blah blah blah right okay so listen when Nvidia was here that was the all-time high okay so just forget this for now right the thing we want to focus on now is when the stock was making a retracement how did Traders find an opportunity to Long the [ __ ] out of this thing and make a bazillion [ __ ] dollar look encapsulate support right this might be a little bit of a bigger box okay it's fine that is support it was support here for that move support here for that move support for this support for that so when price tumbled all the way back down there you better believe that the [ __ ] were drawing little boxes and saying okay I'm going to buy this thing and if it Wicks underneath of it I'm still good because guess what that was on The
27:19Daily folks those candles that hit that green box look at this on the weekly that candle right that candle right goes underneath it and then it doesn't have another weekly candle that opens and closes underneath support so that support remains so when the stock opens here on this week and starts to run Traders will then enter a position with a clear clear clear clear clear clear defined risk and reward the risk is the low because they're making a bet that is the wick into the stop-loss hunting that sends the stock up through via liquidity purposes so when it bounces at support they will then take that entry even though they've already missed right they've already missed [ __ ] 6% oh no oh no right oh they've already missed missed you know 10% oh no they've got the confirmation they need to have a clear defined risk and reward the risk is the low of 11% the reward is prior highs of 157 and any [ __ ] that was lucky enough to buy that thing back down there at the bottom of the market retracement ended up making a bazillion [ __ ] dollars and one of the best [ __ ] trades of this century and all it was is just drawing the dumb idiot [ __ ] green boxes that's it baby that's it simplify your system when the stock gets to resistance does it have bearish Di virgin does it have reason for failure when Tesla hit this level you had multiple touches of bearish Divergence forming off of these highs d d d that was two touches right there from that high to that high to that high at the resistance with a harmonic at the Box easy that's that's free money even if it doesn't work out I'm going to get stopped out for a very minimal loss it's not going to break my bank account it is the risk that we take with trading these stocks but when you've got a clear defined setup right look at snowflake is probably one of the best most recent examples look at snowflake right snowflake was [ __ ] easy how did we make it [ __ ] easy bro Bros look we literally just drew a [ __ ] box this was the last all-time low supportive lows so all
30:23we got to do is basically just take a rough estimated box right draw that [ __ ] across and look and the thesis on this on something like snowflake is so simple it's it's so simple right guys because check it out check it out check it out listen carefully if you take a chance on buying it support you were essentially saying bro I don't think the shorts have the ability to slam price through support this is a big stock this is a big company if you don't think the shorts have the ability to do so every time they test those lows you are looking at an opportunity of accumulating because you're betting that the Bulls are going to jump in alongside with you to propel it off of support and every time you take these trades you have clear defined risk whether it's it whether it's 5% 10% 20 I it's up to you but draw boxes make life easy I don't none of you should care how people view you well he draw boxes around thing what is he no stradamus shut the [ __ ] like who C who cares bro I'm trying to make money I don't care about people's personal opinions of me on [ __ ] Twitter or what they think about my who cares make money right but make your entries and exits as simple as possible and as simple as possible is just literally guys let me pick I'll literally start I'll just type in random letters I'll type in random letters we're going to pick a random stock okay and I'll show you okay Let's uh F let's start with f and then let's do H let's see if anything comes up no let's try ft okay Franklin Universal trust perfect okay look here easy look it look it look look we'll just draw boxes on these things right we'll just draw boxes on this and make it super [ __ ] easy right look at this look at this look at this look at this look at this okay first immediate low that we can notice is right here right and so we'll just take a rough box around that kind of area just draw that across and look at it look at it look at how many times the thing even Wicked into that and
33:02gave you opportunities look at this the first time you ever tested that box that gave you a 90% move next time you Wicked below it but we'll just say you buy it every time it gets there 72% the next time it got to that very same box also Wicked slightly underneath it no big deal 48% gain next time it did that another big gain next time it did that oh no market crash market crash oh but then we recovered after the market crash tested it again bye-bye test it again byebye tested it again bye-bye test it testing it again bye-bye right and now let's draw the resistance boxes right well we can see this resistance this is pretty clear so we draw that across right so we're not we haven't been there recently so that's okay right the next one that we can draw looks like this was resistance right here before this kind of pushed down like the 0102 crash right so kind of encapsulate that price action right and draw oh look at that right ooh pretty shiny Red Box showing us resistance points ooh right and then if maybe if we were like oh I want to take a trade on this thing I'm like thinking about a trade on this thing how how could I do that well I can clearly see that this High these highs here are all kind of connected so I'll encapsulate that right drag oh no oh no oh no the stock is at resistance o ooh ooh ooh ooh then I'm going to zoom into the daily time frame I'm going to say is there any divergences or anything ooh ooh ooh ooh multiple touches of bearish Divergence oh no and then what happens if the daily RSI loses Center oh that thing's definitely going to go down oh yeah bro Bros that thing's definitely going to go down that's easy right if it holds on to the center line maybe it can hold on to this box and then maybe we can turn it green you know maybe we can push off it and then use it as support but as of right now bro Bros it's not looking good cuz you're at the Box you've got a shitty super extra weird death cross and you've got the RSI looking like a turd all
35:08it needs now is if the RSI lost the center this thing is definitely going to dump and it's definitely going to test those moving averages but you see how like you can just make trading so simple it it doesn't need to be complex or complicated you just identify the easiest [ __ ] trades to make sometimes the easiest trades to make are just simple support and resistance you don't need to complicated with divergences and harmonics and macd and [ __ ] whatever else right keep it simple stupid so chat that is it for the first lesson on better entries and exits and we will have a followup to this video so thank you for tuning in