DMI/ADX Lesson — Jackie Le' Tits — Video Wiki
Chart Drops 📈 (6)
The Receipts 🧾
Full transcript (7,847 words) — every glorious word
0:05wow okay so a lot of you are not very familiar with it at all all right very interesting okay so the DMI ax all right the DMI adx all right so the DMI adx all right now I will give you guys one guess all right I'll give you guys one guess and we'll see if the chat box can get this does anybody remember the name of the person that created the DMI adx we talked about it last week when we were looking at one of the other indicators do you guys remember the name of that person ah there it is andyman andyman was the first one I saw with it so folks J Wells Wilder the same man that created the RSI indicator is also the creator of the DMI adx indicator all right so that's why you'll see a lot of Traders use the dmis in combination with the RSI because the same person that created the RSI is the same person that has created the indicator that you see on your screens in front of you all right now what is so special about this particular indicator first and foremost I'm going to turn off the dmis okay and that is going to leave us with what is known as the adx indicator okay now the adx indicator is 1/2 of the DMI adx indicator and what the adx shows you is Trend strength all right that's what this line that you guys see on the charts right now this is referred to as the adx or average directional movement all right and this part of the indicator right here shows you Trend strength displayed on its own indicator and chart now how can you identify when the trend is strong versus when the trend is weak well you guys can see that on my indicator that I've created on here the adx actually changes colors when it goes above or below certain levels so for all of you guys listening this is going to be worth writing down every time that the adx goes below 20 on this particular indicator it goes from zero all the way to 100 and above but very it's it'll never go that high this indicator basically reads 0 to 100 right very similar to how the RSI is calculated this shows 0 to 100 and so
3:33when this indicator goes above or below 20 it shows another sign or signal of strength so when we see the adx underneath 20 you guys can see that the indicator shifts to a light blue color that light blue shift in color is trying to tell you that the trend strength is very weak so if I go through and Mark with vertical lines here just on let's just say this to here and this to here and then let's do this if we look at the spaces on the chart between those white trend lines you will see that price doesn't typically do very much you'll notice that if we go from this white line to the conclusion of this white line price only moved 2% on waste m management if you go from this white line to this white line price only moved 4.8% and if we go to this most recent example you'll see that price almost didn't move [ __ ] at all only 1% so when you see the adx indicator underneath 20 it is trying to signal to you that there is no strength of the current Trend taking place now let me ask this question for you guys listen listening is there another indicator that comes to mind when you hear me speak about this is there another indicator in your guys's Minds that sounds like it does something very similar to what the adx does not the RSI not the RSI and not the macd not quite guys think of ah somebody got it someone got it I see one person's got it so far let's see can we get a sec ah I see a second person oh I see a third a fourth and a fifth oh I'm beginning to see those answers I'm beginning to see the right answer for those of you that answered Ballinger bands I would tend to agree with you because here's something that you'll notice if I take those same white trend lines at the time when waste management was below 20 on the adx all right and then I open up the Ballinger bands you guys will notice that in this subsection of price action look at how tight those Ballinger bands were right look at how tight those Ballinger bands were signaling that there was going to be an explosive move
6:32taking place and it was also telling you that the strength of whatever was currently happening in terms of the trending move was not very strong given that those Ballinger bands were very tightly packed together when the Ballinger bands are tight packly together you guys know that that means that the standard deviation move on the high side and the standard deviation of the move on the low side are very very very tight meaning that price doesn't typically move very much well the same thing can be said about the adx indicator when you see this thing underneath 20 it is trying to suggest to you that volatility has exited the chat that's a really important note note for you guys to write down when the adx is underneath 20 it is trying to tell you that volatility has exited the chat and interestingly enough it also just so happens to align with how the Ballinger bands look at this same moment in time isn't that interesting now let's go to the next half of the question when the adx is between 20 and 20 5 what that is trying to tell you is that volatility and that the trend is beginning to show the beginning signs of strength whether it's in a bearish downtrend or in a bullish uptrend the adx does not care the adx does not care the adx only cares about the strength of the trend current ly taking place so let me ask you guys here right let me ask you guys here in this circled Zone when you saw the adx continue to stay above 25 what do you think happened within this range of price action so I'll just put vertical lines on here again what do you guys think happened in that in between those white lines to the trend or the trending move now you guys haven't seen the chart so you don't know if it's up or down so let's just assume we don't care if it's up or down so what do you guys think let's assume that the trend is up so what do you think happened with price in between that area of both those white vertical lines some of you guys are saying volatility beautiful answers some of you guys are saying reversals some of you guys are saying big up moves some say
9:27saying flat I'm saying sideways I would say to you without having looked at this that if this were an uptrending move right I'm just going to make an assumption If This Were an uptrending move and the adx was staying in this range it's telling me that the volatility on that upside move remains really high and is beginning to show a strength of that trending move so if this is an upside move my expectation is that in between those white lines you will see big candles could be up and down but you will see big candles and because this is signaling that the trend strength is still relatively strong it's probably going to be big moves on the high side if this is an uptrending move so let's open it we open this up and look at that folks look at those big ass candles that happened on Waste Management within this section first of all from the top to the bottom you made a 7% move uh up to the down and then following that you then made a 15% move to the upside on top of that 15% move to the upside look at the size of some of these candles that's a 6% candle that's uh well it says 1.7 that's surprising I thought that'd be more than that but these are volatile candles given if you just look back at the prior range of price and what price was doing look at all this dog [ __ ] look at all this dog [ __ ] and then look at what happens once the adx tries to confirm for you that the strength of trend is still very much alive and well well then you get bigger more volatile candles and then it begins to make a move to the upside now let's go to the next part of the adx when the adx rises above 25 it is trying to tell you that the strength of that trend is very strong and if you're trading an uptrend in which we identified this here if you're trading an uptrend and that adx rises above 25 and stays above 25 it is telling you that the strength of that trending move is very good and then look at what precedes it look at what happens when the adx breaks above 25 here look
11:54how it stays above it and then look how it rises exponentially and in the that rise exponentially look at how much price moves 22% so this DMI adx indicator the adx half of the indicator is trying to show you when the trend is favorable versus when the trend is wishy-washy so does that make sense chat do you are you guys with me on that one is that good you guys understand how the adx Works in a sense just give me a bunch of ggs or TGs or whatever if you guys think that that's useful fast daddy guys he's made it he's here he accepted the friend request yeah buddy we did it it's fast Eddie yeah buddy let's go yeah [ __ ] yeah man we've been waiting forever for this [ __ ] let's go [Laughter] man all right so it sounds like a lot of you guys understand the adx let me ask the chat box really quick does anybody have any questions so far regarding the adx and at the end of this video I'm going to put this in a way that's going to make a lot of sense for you guys also Mr Fusion also accept my friend request so we've also got him in there now folks oh okay so a couple of you guys are asking where to find the DMI adx indicator this one right here is actually one that I've created okay but fortunately there is another one that I have here let me open this up for you guys so this one right here by crypto Adrian so there's this one here from crypto Adrian I'm going to post that in the chat box for you guys I'll post it in the chat box there for you guys and yes this video is being recorded and it will be on Discord later yes bored at work that is a fantastic question my friend that is is a [ __ ] fantastic question very great question so our guy right here board at work says does the valy at the bottom signify the end of a trend I.E a reversal I wouldn't necessarily think of it as a reversal but I would certainly agree with you that when the adx goes underneath 20 it is signaling the end of that trending move taking place so we
15:29can see in this range right here right so from here to here we can see that the adx was Rising really high telling us that the strength of that downtrending move was really strong and once it started to go underneath 20 oops once it started to go underneath 20 that is when it signaled the end of that trending move and then you can see that every everything started to pick back up and we're going to start adding in the dmis here as well okay we're going to start adding in the dmis as well for you guys to add another layer of context to this indicator but I would certainly agree with you that when we see the adx fall below 20 it is as it is typically a signal that the end of that trending move is taking place so that's a great question would I mind posting my settings I I don't I think so so there's my settings for you guys all right so let's see hi chew infusion I haven't yet no okay so here's what we're going to do next all right folks here's here what we're going to do next all right here's what we're going to do next so now that you guys have a reasonable understanding of the adx now we're going to add in the dmis okay now we're going to add in the dmis so oops so I'm going to hide the adx for now okay and we'll throw this all together in just a minute so now on your guys' screens you see a a red negative DMI and you see a yellow positive DMI okay that's how I've color coordinated my stuff so positive DMI negative DMI those are the color coordinations that I've done for those all right now with regards to the dmis the dmis are calculated via price okay these dmis are calculated via price moving up and down and it's a very complex um calculation so I don't want you guys to get caught up in the co the calculation what I want you guys to remember is that the dmis are actually calculated and so is the adx with a 14 lookback period does anybody else know what other indicator has a 14 period look back does anybody know of another indicator with a 14 period look back let's
18:23see if chat can get this one quickly look at that excellent chat so yes the RSI the RSI has a 14 lookback period so very well done isn't it interesting that the creator of the RSI is also the creator of the DMI adx which uses the same look back period isn't that interesting chat all right so these are the dmis and these are very similar to the RSI you guys can kind of think of it like the RSI but instead of only getting one line on the RSI you get two with the dmis one specifically shows negative and one specifically shows positive so let me ask the chat box here quickly if you see the positive DMI above the negative do you think that means that price went higher or do you think that means price went lower what do you guys think so like in this example right here chat do you think that Waste Management went up or down with the DMI positives being above 25 and well above the negative DMI do you think price went higher or lower all right sounds like a lot of people are are saying up so let's look at the chart and look at that folks you guys are banging on the money look at that the the DMI positive way above 25 and look at it just fly fly fly right so great job chat good job now let me ask you guys again right let me ask you guys again in this circled area here do you think price flew or do you think Price died with the DMI negative now being above 25 and well above the DMI positive do you think price went down or do you think price went up okay good a lot of you guys are saying down fantastic open up the chart look at that folks you've once again [ __ ] nailed it look at that chat you fck [ __ ] nailed it once again you [ __ ] Geniuses look it right when the DMI crossed when the DMI negative cross the DMI positive right here and then the DMI negative Rose above 25 look at the negative moves that were seeing on Waste Management right so when you see the dmis whichever one is on the high side of the other one that typically
21:27shows which party is in control whether it's the Bulls or whether it's the Bears that's what the dmis do a job at is to try and show you who has taken control right now here is where things are going to start getting getting a little bit complex and complicated yes uh scav excellent well said he said so the DMI gives you Direction and the adx and the adx gives you the trend strength exactly you've got it bang on the money my friend now here's where things are going to start getting a little complex okay and I'm going to I'm going to start [ __ ] with you guys a little bit and it's not on purpose it's to try and share something with you okay now let me just open this up and see okay perfect this is great perfect example now let me ask you guys what is this that I'm circling on the chart what are those three circles a representation of folks what are those three circles a representation of beautiful beautiful guitar beautiful Ricky Bobby beautiful MC beautiful ukaine oh Kyle interesting interesting interesting great answers chat so the answer that I was looking for is lower highs all right lower highs now if we open up price action where price was at the same time each one of those Peaks was made chat what is this that I have circled on price action what is this that I've circled on price action right there what is that what is this called right here yes chat yes chat very good very good yes higher highs higher highs that's exactly right but when we were just looking at the adx aren't these lower highs would you agree with me chat that the ad or excuse me the DMI was printing lower highs while price printed higher highs would you agree with me chat and what do we often refer to that as what do we often refer to that as chat what is that often referred to as what would you guys call that aha UHA UHA very good chat very good that is what we would call bearish Divergence because the indicator makes three consecutive lower highs while price action makes three consecutive higher highs and those touches of bearish Divergence led to a reversal on price action where the DMI
24:32negative then crossed above the DMI positive on that vertical line and waste management Waste Management made a 45% move to the downside now let's also look at it from a bearish perspective all right let's look at this from a bearish perspective okay so let's look over here let's start with no I guess this might not be the best stock to do this on all right we'll do it here all right chat what is this that I have circled on price action what have I circled on price action forget the indicator for a second what have I circled on price action ction with these three green circles lower lows excellent well done chat yes lower lows okay now when I Circle the DMI negative what are these three circles what are those three circles chat forget about Divergence forget about price action what are those things on the DMI that I've circled in green exactly lower lows well done chat very well done those are three consecutive lower lows and price has made three consecutive lower lows but that's not how this indicator functions because the DMI is trying to show you when there are strength in the moves that are taking place so when this thing is making lower lows shouldn't the negative DMI be going higher than the prior High signaling that each move is consecutively a lower low signaling that there is a strength behind each one of these lows that are being made and so this is why the DMI adx can get a little bit complicated because people would look at this and they'll say well those are three lower lows and so that's exactly what happened with price but the actual truth in the the matter is is that these were three lower lows which should have been three higher highs because it is trying to tell you right it is trying to show you that price is making lower lows but there is Divergence formed on the DMI right here with three touches of said Divergence now not only that you actually printed a fourth one right you actually arguably printed a fourth one right because this was supposed to be the lowest low and you can see that signified by the DMI negative being as high as it was right and so that should have eliminated all of
27:38the bearish Divergence but here's where we're going to start throwing in the adx okay here's where we're going to start throwing in the adx you guys will notice that on that third lower low that the a ex actually began to Peak and turn over and when that began to turn over it was signaling that there was a lot of hesitation and a lot of unknown that was happening on price action in this moment and then with this lower low the DMI confirmed that it was a lower low with no bearish Divergence but the adx failed to break above the prior high that we were at when when we were going lower now that is not bearish Divergence but what it is telling you is that there is a weakening of that Trend right because this is what that indicator does best the adx is what tells you about Trend strength and if the adx fails to rise higher while price makes a lower low it is trying to signal to you that there is a weakening of trend strength now just because the adx Rose above 25 doesn't inherently mean that this thing was just going to slam to the ground we had to put it into the context of this larger downtrending move and we can see that the difference from this high here to this High here is lower and so you are seeing a weakening of that Trend strength and then you guys can see as we move over right that the adx completely dropped underneath 20 and it signaled that by shifting colors to that that lighter shade of blue and then in between that move happening what happened right here chat what happened right here on that vertical line between the dmis what happened between the dmis all right Jay Dunlop is going to be the only one commenting I guess so Jay Dunlop said they crossed and Jay Dunlop you're bang on the money the DMI positive crossed above the DMI negative and then as that DMI positive crossed it then broke above 25 right here and when it broke above 25 chat what also happened to the adx what happened to the ad X at the same time that the DMI positive crossed above 25 yes exactly it broke above 20 and it started to 6 signal to
30:51us that there was some Trend strength beginning to show up and then it Rose above 25 and look at what happened to price once you Rose above 25 chat look at what happened to price once you Rose above 25 look at that now let me ask the chat really quickly when the adx rose above 25 and the DMI positive cross the DMI negative did the DMI positive ever break below the DMI negative yes or no during that white trend line to this white trend line here oops did the DMI positive ever break below the DMI negative yes or no chat exactly you're exactly correct it never did now actually it did right here I I should have I should have paid more attention it actually did right here but that's okay it never during in between those two white trend lines it never broke below the negative DMI and Beyond the fact that it never broke below the negative DMI chat where was the adx the entire time where was the adx the entire time of that whole move Bingo chat [ __ ] Bingo the adx was soaring like a [ __ ] Eagle signaling to me what chat what is the adx being as high as it was what was that signaling to me in that moment what was it yes yes yes Chan yes yes guitar yes Bard yes Jacob yes patient yes Varsity yes Soldier yes sto yes everybody yes strength of trend yes yes yes yes yes so this indicator right here when used correctly in combination with things such as the RSI you can find yourself making some very significant and really great trades right now let's throw in one more piece of technical analysis on this particular chart and then I'm going to give you guys a um a fun little example on the adx DMI all right where was the RSI in between both of those white trend lines the whole time what did the RSI not break in between both of those white trend lines folks what did the RSI not break yes Chad yes yes yes yes yes the RSI never once went below the center line the entire time that the adx was trying to say hey bro we're going to the moon man we're going to the Moon bro and then the RSI
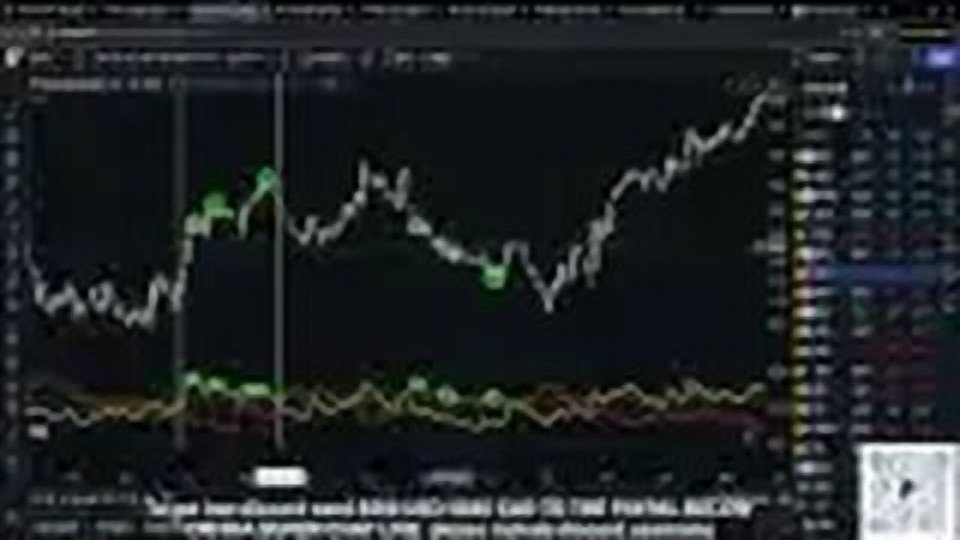
34:40was like okay bro let's go to the Moon bro and never once even sniff the center line never once did it even sniff the center line it stayed above it the entire time and when the RSI stays above the center line chat what do we consider that when the RSI stays above the center line what do we typically call that yes yes yes yes yes yes yes yes yes yes yes yes yes yes yes yes yes chat [ __ ] a we call that bullish when you stay above the upper half of the RSI we are considering that the bullish half of the RSI so you stayed in the bullish half of the RSI the same time that your DMI positive broke above 25 at the same time that your adx broke above 25 that is signaling to you nothing but bullishness nothing but bullishness so this is not the end of the lesson I just want to ask you guys does the DMI and the adx start to make a little bit more sense now does this indicator make a little bit more sense to you chat yay or [Music] nay all right now just a quick little fun thing here over to GameStop quickly so chat looking at GameStop using the adx DMI indicator what happened right here on that white vertical line what happened on that white vertical line on the ad on the adx DMI more specifically I'm looking at what happened with the dmis what happened to the dmis on that white vertical line all right a good little bunch of answers that's great DMI positive cross great above 20 great answer so I'm loving both of those answers you're exactly right now what happened right here chat what happened on this second vertical line right here what happened on that second vertical line for gme what happened right there there's a couple things that happened oh I like that word confirmation that's a good one I like that one cross into a reversal very nice adx starts to rise beautiful bull stepped in I'll roll with that bounce off the center nice answer adx cross above 20 great answer positive DMI goes up big great answer yes chat beautiful beautiful [ __ ] answers chat great answers your DMI positive stayed above the DMI negative and your adx then
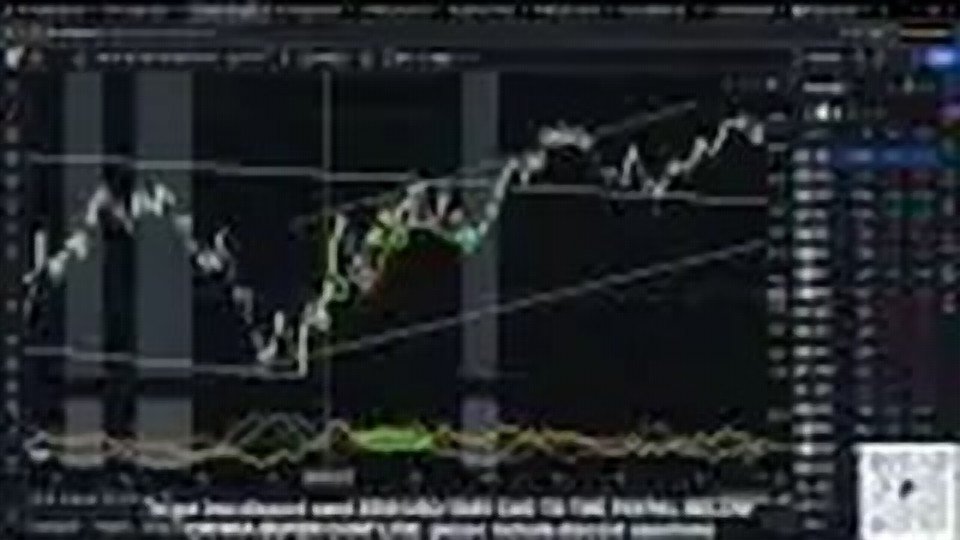
38:22Rose above 25 sign in what chat signaling what boom boom boom signaling a strong powerful move was about to take place and chat look at what happened look at what happened happened yeah I'm I'm going to go ahead and say 424 per is probably a pretty good [ __ ] move now here's where I'm going to add in one more layer all right we're looking at the RSI what happened to the RSI at the same time that the dmis broke out and the adx broke out what happened to the RSI at that same moment in time yes Brandon yes yes yes yes you crossed above the center line after spending weeks underneath it weeks underneath the center line and then you broke through it at the same time that the DMI positive was like breakout and then the adx was like I got you bro full steam ahead and this is how you can use a multitude of indicators in combination with one another to build out these thesises okay now let me ask the chat box on the daily time frame on gme now I don't want to turn this into a gme discussion but let me just ask the chat box here really quick actually here's a quick little tip for you guys here's a quick little tip anytime any time on any chart okay let me make sure I say that loud and clear enough for every single one of you guys listening any time that you see the dmis break above 50 it means that that trending move is getting ear close to ending and more specifically when you see the adx rise above 50 that typically means that the end of that move is very close to taking place you will see if I zoom out there are very few instances in which gme on The Daily had its adx and its DM I both break 5050 in fact the last time that that happened was right here and I don't have to be the first one to show you that that basically marked the top of the sneeze before a multi-year retracement now I'm not saying that that's happening with gme I'm not saying that there's going to be a multi-year retracement but chat what happened right here what happened on this oops I put a horizontal one I
41:53didn't mean to do that what happened right here chat fck [ __ ] I did it again what happened right there where that white vertical line is let's make it let's make it orange so everybody can see it what happened on that orange vertical line well your adx basically crossed above 50 and your DMI was also above 50 what Jackie why did you tell us to take profit because the indicators [ __ ] said so because the DMI the first time back here Rose above 50 look at what happened to price it stabilized for [ __ ] four days and then look at what happened the next time it Rose above it price peaked out and then had a huge retracement and then look at what happened right here it Rose above 50 again and then it had a big retracement again so 50 on the DMI adx indicator can typically be a signal of that stock or that trending move that you were being a part of or taking place with a rise above 50 can generally signal that the end of that trending move is coming okay so does that and to your question Brandon B all indicators have more reliability on large time frames all indicators have more reliability the higher the time frame that you were on is the Jackie indicator based off of this indicator sh shut up so let me ask the chat box chat does that make sense does that make sense chat are you with me now I'm going to finish this lesson off by giving you guys a little bit of a uh a story about the dmis adx and this is how I learned how to trade this indicator okay this is how I learned how to trade this indicator so we're going to pick another random stock uh I what's V what's a v stock yeah let's do Visa that's a good one all right and we'll do this little range of price action right here all right so you guys have heard me talk about this before you guys have heard me explain it and describe it like this before how many of you guys drink coffee or how many of you guys drink warm beverages tell me in the chat box I'm being dead serious how many of you guys drink coffee
44:57or hot beverages okay lots of people this is going to be a great example for all of you guys so I want every single one of you to listen to this carefully okay I want all of you guys to listen to me very carefully right now okay I want all of you guys to listen to me as carefully as you can because I'm going to blow your [ __ ] minds with this description on the adx DMI okay I'm actually going to [ __ ] you up now when the adx now I'm just going to hide the dmis because we don't need them right now when the adx is underneath 20 imagine that you are beginning to make a pot of coffee when you make a pot of coffee right when you put the water into the coffee maker and all that kind of stuff the water typically starts out cold and the coffee hasn't been brewed yet would you agree with me chat do you guys agree with me on that I just want to make sure that all of you guys follow this concept with me but when the adx is below 20 right I like to compare it to the idea of you beginning to start boiling a cup of coffee right you start brewing your cup of coffee when the adx is underneath 20 now as that adx begins to rise when it breaks above 20 that is similar to your coffee starting to get warmer now how many of you guys like to just drink warm BL coffee probably not a lot of you guys right a lot of you guys don't really like making just mediocre sort of warm coffee right a lot of you guys love hot coffee right we all like hot coffee so when you see the adx begin to rise and the adx then begins to rise above 20 that is very similar to the water for your coffee beginning to heat up okay and then as you begin to see the adx rise above 25 that is now your coffee beginning to boil that is your water beginning to boil to actually make hot coffee right imagine it like the little whistle on the [ __ ] thing right right you have now made hot coffee when the adx rises above 20 5 and
47:58everybody likes a good cup of hot coffee right so if you guys like hot coffee wouldn't that mean that when the adx rises above 25 that you should be making your cup of bullish or bearish coffee isn't that right so then if we open up the dmis and we see that as our coffee is boiling right our coffee boiling it's really hot and the DMI negative is [ __ ] way up there shouldn't we right here then begin to make our bearish pot of coffee should we not on that orange vertical line begin to brew our bearish hot cup of coffee well let's see what happens we open up Visa's chart and we started boiling up that coffee boy we made a pretty good decision right we made a pretty good decision because then this stock ended up dropping 6% right now back on to the little analogy right back to the little analogy as the adx begins to drop isn't the coffee still hot right isn't the coffee still hot I would tend to think that the coffee is still very hot even if if the adx is dropping like it does right here right even if the adx drops right here is that coffee not still hot is that coffee not still hot well I certainly think it is right but right we have to remember that the dmis also play their role and in this regard we went from making a cup of very nice bearish coffee until the DMI positive crossed above the DMI negative and when that cross happened was the coffee still hot chat let me ask the chat really quick right here where my cursor is is the coffee still hot in this instance right here yes I would tend to agree with you guys that the coffee is still hot right here but if the coffee is still hot and the DMI positives have now crossed above the DMI negatives Are We Now considering the idea of now making bullish hot coffee shouldn't we be making bullish hot coffee now and so if you took some bullish hot coffee right here when the adx began to rise telling us that the coffee is still hot and you saw the DMI positive cross right here and we made a cup of hot bullish coffee on that orange vertical
51:15line look at what happened to us chat 13.7% move to the upside and we didn't have to do [ __ ] other than just listen to what the dmis and the adx were trying to tell us and even here chat let me ask you guys this even in this green circled area the coffee might not be hot but is the coffee still warm enough would you make coffee with this adx and the DMI as high as it is yes or no would you guys make coffee with this warm adx and this very hot DMI would you make coffee cuz I know I probably would and if I made coffee with this after our initial long that we took from here well folks look at this look at it from that initial long that we took if we stayed through all of that warm coffee you made an additional 2% and that matters right and then look at what happens right and then your adx really starts to cool off right and now here's my next question for chat are you interested in a cup of coffee in that green circle yay or nay are you interested in a cup of coffee between those green circles what do you think chat love it love it love it love it love it I probably wouldn't make coffee with it either and during that period of time look at the wishy-washy price action that took took uh took hold of the stock look at this the price literally went up 81 cents or 37% from the moment the adx went below 20 to the moment that the adx then began to rise above 20 so I use this coffee analogy as a way to describe how this indicator works and it's not always going to be perfect just like any indicator right it's not going to be perfect just like any other [ __ ] indicator that exists in the world but when you pair it in combination with your RSI and you pair it with whatever other indicators you're using that could be the moving averages or the Ballinger bands or whatever it is that you're using in the moment right you can use all of these things right to help you identify and find really solid trades right so I think chat that is probably going
54:21to do it for the DMI and adx lesson so do you feel as though you have learned something or taken something away from this lesson that we have now done over the last 60 minutes all right kley I'm not sure what the ad XR is I I've I've never heard of that to be honest with you I've never heard of AD XR you guys were asking me for the DMI indicator that I use it's from crypto Adrian now I have my own that I created and I'm not sure that I want to give this one away yet but this one from crypto Adrian right here I do have this one I do use this all right so I'm going to post it in the chat box for you guys and then I'm also going to add it to my chart and I'm going to add it to my chart so you guys can have all of my settings with this because I've completely customized this thing as well all right I've completely customized this one as well so you guys can use these settings so chat go into the chat box right now and look for my comment I just posted it in the chat box there for you guys that's the DMI indicator that I used to use before so go ahead and click that for me and then here are all of my settings for that indicator all right so here are the first batch of the settings for that indicator okay so make sure you write all this down chat and this video will be in the Discord for you guys later this video will be uploaded later in the Discord is this indicator free yes this indicator is free Yep this one is particularly free okay and then here's the stuff here's the like colors and [ __ ] that I've changed to okay so here's all the stuff that I've changed to so you guys can copy all this down if you want to as well what do you mean why did you not take profit Stephen what do you mean all right so that's it for that indicator there folks I'm just going to answer this question for Stephen what do you mean why did you not take profit when the adx went in between 20 and 25 well
57:16isn't the coffee still warm isn't the coffee still warm when the adx is between 20 and 25 you can still have coffee it's not going to be hot coffee but it's going to be warm enough for you to drink so wouldn't you still want to take a piece of advantage of that potential move you know like does that make sense Steve so guys this lesson will be posted in the Discord this lesson will be posted in the Discord oh my massage guns out for delivery let's go what was your Super Chat comment sorry I missed it I'm just opening up YouTube give me one second I I'll find your thing uh just FYI uh clay clay hey clay clayy uh I'm not sure what the adx r is uh my newb observation to DMI adx is when they tighten up like Ballinger bands and eventually cross that's when you see the most volatile price action I would tend to agree with that I would tend to agree with that yeah I think that that's a reasonable reasonable assessment yeah I would agree with that for sure I think that is a very reasonable assessment good sir yes Justin exactly great great uh great description of gme's price action right now on the daily time frame great great explanation so yes the adx is still very very positive it's currently sitting at 40 and your DMI positive is still sitting well above 25 so on the on the large time frames for gme it is certainly suggestive that gme's trend is still trying to make hot coffee and it's still trying to make bullish hot coffee so I would definitely agree with you on that I would also open up the weekly and I would say to you guys look at the weekly right once this loads look at your weekly your weekly is above 50 your DMI is also above 50 on the weekly so that right there that typically signals that we're going to see some sort of retracement right or it can signal that this stock on the weekly time frame has made one of the largest moves that it has made in three and a half to four years and that this stock if it continues to manage to hold at these highs on the weekly time frame it is certainly suggestive
1:00:23that there is an assload of bullish strength and hot coffee still on this chart but it could ultimately suggest that perhaps gme n needs to take a little bit of a breather right needs to allow it to have a moment to cool down right the coffee it's too hot it's just too hot and so if the coffee is too hot we've got to let it cool down a little [Music] bit and when that coffee cools down then the time will be right and you guys can see that that coffee right has been very hot but the DMI positive has been cocaine out and over the last several weeks we have seen that this DMI positive has slowly but surely found its way down which has allowed the coffee to cool off a little bit before perhaps a secondary run will take place on gme so we this is why I've been screaming you guys we just need to have patience that's it that that that's just the long and the short of it is we just need to have patience but yes you guys yes you are you are already figuring it out now I'm very impressed so I'm going to end this recording okay so this is going to be the end of the video 1 hour and 1 minute long all right so thank you guys all for tuning in there all right we're going to end this right here