Fib Time Zones; What are they? — Jackie Le' Tits — Video Wiki
Chart Drops 📈 (6)
The Receipts 🧾
Full transcript (1,499 words) — every glorious word
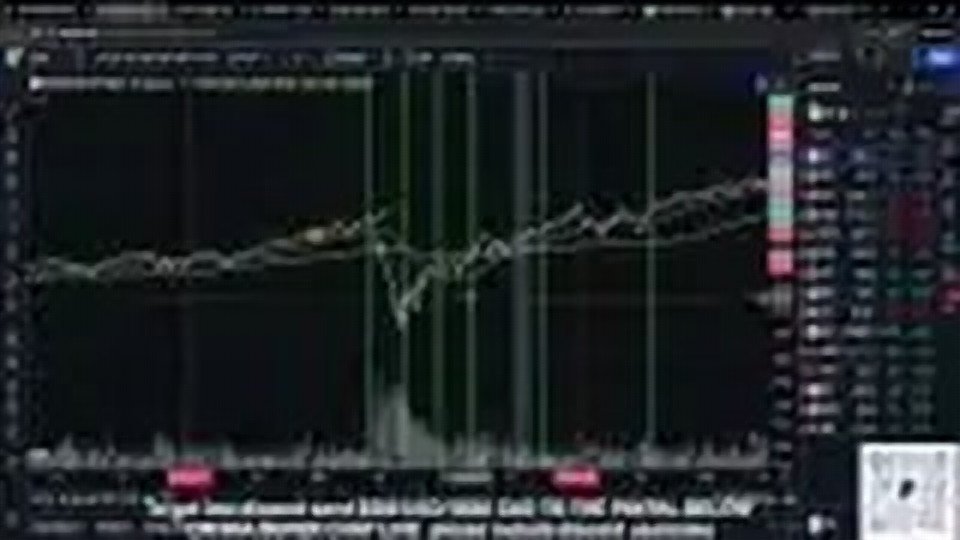
0:01so a couple people have asked me before uh about something called Fibonacci time zones so on trading view in the upper leftand corner here where you normally pull out your FIB retracements there's a whole slew of extra little things that are in here and one of the things that people have seen me use from time to time is these Fibonacci time zones and people ask me uh a couple of questions the two most common ones that I get uh fairly frequency frequently are what are they and what do they do so like all things Fibonacci uh they are just meant to show like large pivot Points on charts now these FIB time zones perform best when they're done on like large time frames like daily weekly sometimes even the monthly but with these FIB time zones the way that you draw these as you go into trading view you click the Fibonacci time zone and you draw these FIB time zones from highs in charts to lows or lows to highs however you want to draw them all right so in this instance here uh right so what I'd like to do is I would like to pull one let's just say from the high before covid to the covid low and it'll pull out a whole bunch of Fibonacci here for me okay so you guys will see this in a second pulls out a whole bunch of Fibonacci here for us right and all these all these uh vertical lines that you see the the green vertical lines on your chart these are the Fibonacci time zones so to answer the first question of what are they they are essentially just trying to predict moments on the chart where there may be pivots okay so when you draw these these Fibonacci time zones from a high to a low or a low to a high or whatever it is that you're drawing right you're just looking at these vertical lines when price goes through them as potential pivots so you use your technical analysis in those moments right along with those potential pivots to give you a moment of potential opportunity in which maybe you're looking for a reversal on a stock or maybe you're looking for a large continuation move you use these pivots generated from the Fibonacci time zones to try
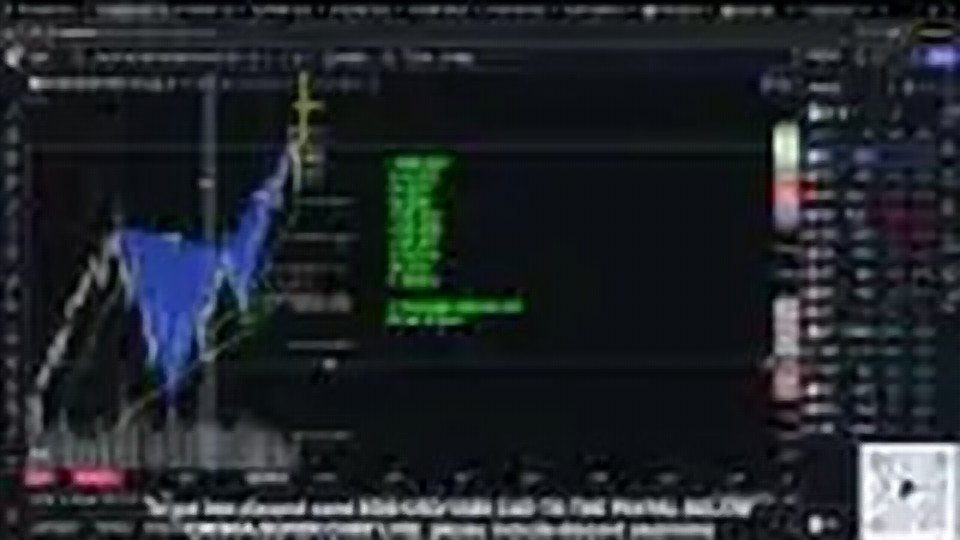
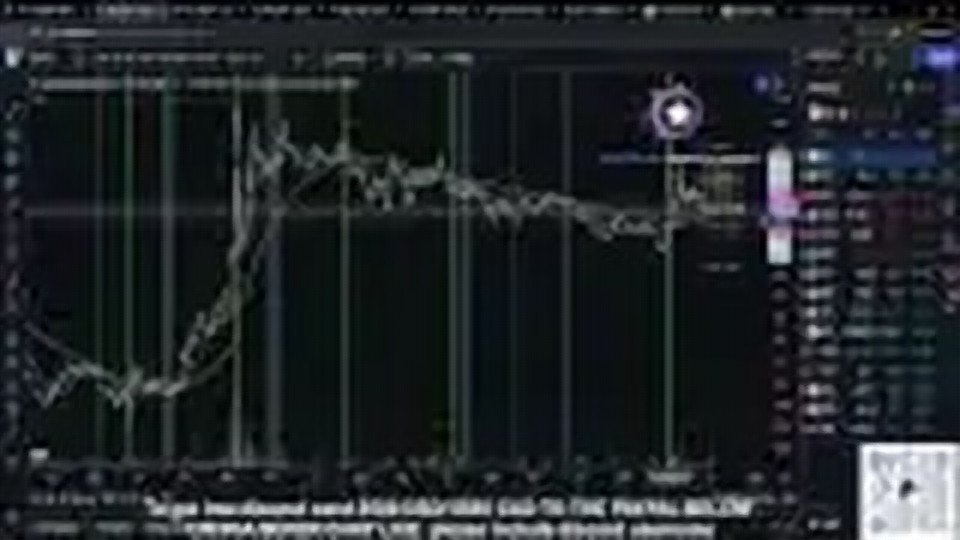
2:22and help time your moves okay so one of the that I would like to actually share with you is on gme okay so on gme now this was like one of the coolest ones like maybe of all time probably you know I'm not you know a mind reader but this is probably like one of the coolest ones of all time so I pull it from the bankruptcy scare lows right when Keith was buying and doing all that kind of stuff right to the sneeze High all right and it generates the green vertical lines that you see on your chart now what what's really interesting is where the cat just so happened to come back right on a daily Fibonacci time zone taken from the all-time low to the all-time high and that Fibonacci time zone was actually what we were using in unison with our technical analysis to help call that giant bottom on gme okay now I'll show you here like what I mean by using our technical analysis all right was that we had a giant bullish butterfly on gme at the same point in time where we had just completed it and then you had that FIB time zone come in so when we were trading this in the moment when we had that Fibonacci time zone we were going wow there must be something that is coming right around that period of time and we had been looking for $10 for a long time we had been waiting for that and waiting and then it got there on the completion of this harmonic structure and we were like well not only is there the completion of the harmonic structure at the level that we have been waiting for but then we have a fib time zone taken from 3 and a half years ago lining up roughly in the same Zone where it looks like we have a really good entry on gme stock and that pivot that FIB time zone happened quite literally two days two days before the cat ended up coming back and doing his Tweet stuff so these Fibonacci time zones right what are they and what do they are moments on the chart using technical analysis along with Fibonacci which is just a way greater conversation right to be predictive of potential pivot Points on a
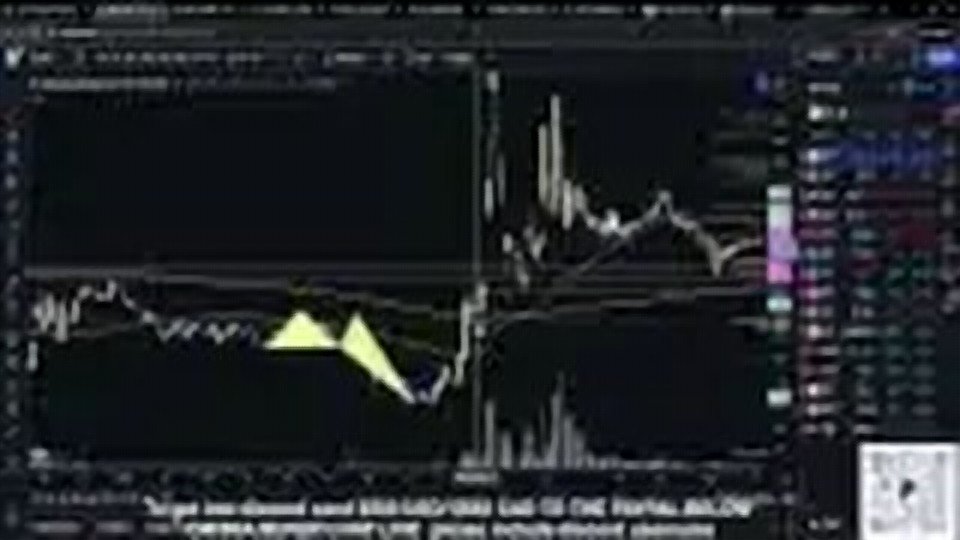
4:52Stock's chart and what's another kicker to this is you don't always have to pick these big moments in times like what we picked on gme picking it from an all-time low to an all-time high and then happening to have this FIB times own line up here sometimes you have like a trend that's going on with a stock right in gme's instance you got the low the high the low the high the low right you've got kind of this trend going on with gme here so also in the tools there's something in here called the trend based FIB time zone these ones are very similar in the way that they're drawn there's just a third point that you draw from so when we draw this one on gme we are going from a low to a high to another low and in the settings here I have adjusted it so that the trend based FIB time zone is using Fibonacci points 382 236 the golden pocket 886 1.618 all the same fibs that we use right and that generates these zones right again these vertical lines now let me get rid of the green one so you don't get confused all those vertical lines are from the trend-based FIB time zone and they show pivot Points on the chart you can see how eerily unbelievable it is that the pivots of the 236 huge candle that day and retracement the 382 huge candle big retracement and the golden pocket the final pivot before the shareholders meeting and gme dropping a total of 22% right these trend-based FIB time zones are supposed to help you identify again moments of potential pivots or interesting points of uh well I points of interest on the charts so if we zoom in a little bit where we have those FIB time zones you can then actually see how important these pivots really became right that 236 pivot came just before there was a 30 plus% Gap up in GameStop that 382 pivot came before there was a multi-day run on gme of 54% the golden pocket pivot right right in this moment where the golden pocket was you guys can see that there was a whole bunch of [ __ ] and then where that golden pocket hit it ran up 15% But ultimately came back down down another 15%
7:28so this was an important moment on the chart and what's really interesting is where price was in that moment is where price almost hovered for the last several [ __ ] weeks at around that $26 range and it was actually exactly where resistance was found on this little push these FIB time zones show moments on the chart and for me personally when I use the trend based ones I don't really look at the 236 the 382 or the 0.5 I really just use the golden pocket the 886 and then the 1.618 the 2618 and the 3618 all right those are really the ones that I use along with that regular FIB time zone okay and all these FIB time zones do is they just show moments of potential pivots on the chart right we could erase this one right here and we could TR we could change the the the trend of this right we could go from this high to this low to this high and now you see how that's kind of changed things right so you have to remember that the more information that you encapsulate within those FIB time zones the more reliable that you would you will find those pivot Points become all right so that's the end of my discussion on FIB time zones and Trend based FIB time zones hopefully you guys have found that useful don't forget to uh you know press a little thumbs up button or do whatever or you can even hit subscribe if you thought that that was kind of neat and uh we'll be doing more things like this uh with the rest of the content we put out so thank you for tuning in and uh we'll see you later